
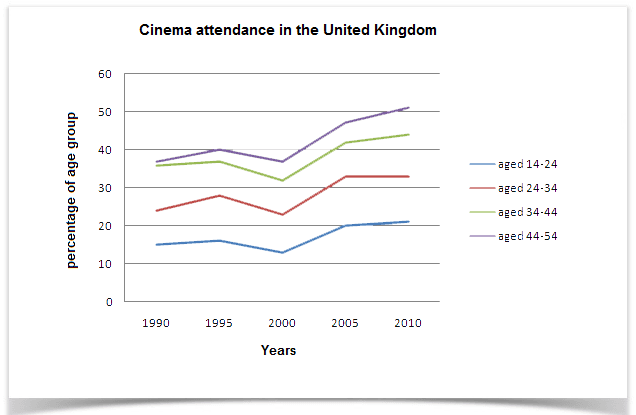
The line chart given indicates how the proportions have changed of those who went to the cinema to watch films and were in different age groups from 14 to 54 between 1990 and 2010.
Overall
, the percentages of all four groups have increased in these four decades but Linking Words
additionally
have slightly fluctuated. Through these details, there is one result that can be suggested that when people are younger, more of them do not like to go to the movie house.
The people aged between 44 and 54 have the highest movie theatre attendance, which took place Linking Words
in
almost half before 2010 and in 2010, it occupied more than 50 per cent. In contrary, those who are presented in the film most not frequently are the youngest group in the age of 14 to 24, which make place lower than 20 per cent bevor 2010 Change preposition
apply
whereas
grew up more than the older proportion.
Linking Words
In addition
, there are Linking Words
also
two groups of figures about those who are between 24 to 44 years old not preponderant. But it is pertinent to mention that the people aged between 24 to 34 have lower cinema attendance than the rest group.Linking Words