
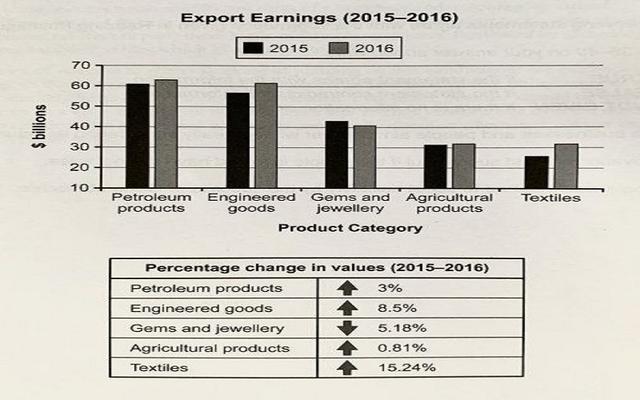
The chart illustrates the volume of the country's exports in different product types from 2015 to 2016 and the units were measured in billions. The table displays changing
proportion
in each product category between 2015 and 2016.
Fix the agreement mistake
proportions
Overall
, the tendency in every category of export experienced an upward trend over the period of time except in gems and jewellery. Linking Words
However
, petroleum goods accounted for the highest in Linking Words
this
country.
Regarding the chart, petroleum is the most exported, it was nearly 60 Linking Words
billion
and gradually increased by 3% to approximately 63 Use synonyms
billion
in 2016. Use synonyms
Nevertheless
, even though textiles had the least amount in both years, they have changed the most, around 26 Linking Words
billion
in 2015 and sharply rose 15.24% to almost 31 Use synonyms
billion
in 2016.
Use synonyms
On the other hand
, Agricultural exports were around 31 Linking Words
billion
in 2015 and steadily went up 0.18% in 2016. Use synonyms
Moreover
, gems and jewellery were the only goods which experienced a downward trend, it was nearly 43 Linking Words
billion
in 2015 and dropped 5.18% to approximately 41 Use synonyms
billion
in 2016.Use synonyms