
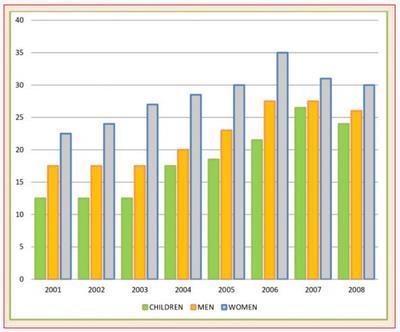
The bar chart below illustrates the number of individuals that ate five portions of vegetables and fruits per day in the period between 2001 and 2008 in the UK.
Overall
,Linking Words
that is
clear that the Linking Words
women
's Use synonyms
percentages
are the total leader in applying all periods of time.After they are Use synonyms
men
,which almost all the time have from 20 to 28 per cent.The outsider is a children's number.The most significant year for all of them was 2004 apply when their numbers differed sharply from the next and previous years
In the apply '
beginning Use synonyms
women
started to rise and Use synonyms
while
children continued to be steady,Linking Words
men
did it too.Use synonyms
However
,in 2003 the Linking Words
men
's percentage rocketed from about 17 to about 22.Use synonyms
This
year was significant for children too,their number grew sharply and did it till 2007.Linking Words
Women
's Use synonyms
percentages
carried on increasing.Use synonyms
However
,2006 was crucial for Linking Words
women
,their numbers started to fall down till the end,Use synonyms
while
Linking Words
men
's Use synonyms
percentages
were stable.After 2007 all three Use synonyms
percentages
started to decreaseUse synonyms