
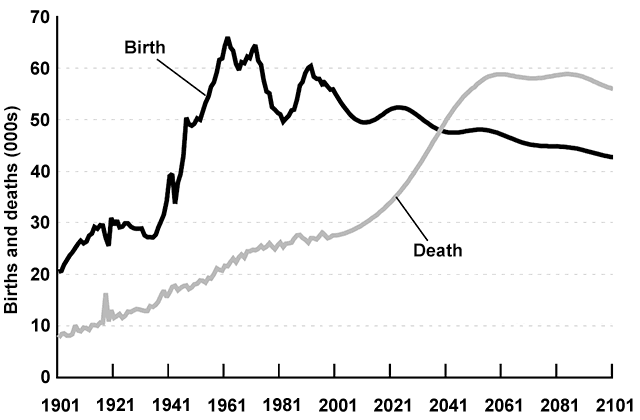
The line graph provides the difference in the
number
of Use synonyms
natality
and mortality of New Zealand’s citizens from 1901 to 2101, counted in thousands.
Use synonyms
Overall
, birth and death rates are estimated to have an upward trend. Linking Words
However
, the proportion of mortality is predicted to outnumber Linking Words
natality
in over 2041.
At the beginning of the period, the birth Use synonyms
number
accounted for about 20.000, Use synonyms
while
the death stood at almost 10.000. In the following years, the Linking Words
natality
rate increased sharply and peaked at approximately 70.000 in 1961 before experiencing a fluctuation until 2021 at about 60.000. Use synonyms
Then
it is forecasted to decrease slightly roughly under 50.000 until the end of the period.
Despite having a gradual growth during the first half of the period, the mortality rate is expected to have a dramatic rise in the following years and overtake the Linking Words
natality
Use synonyms
number
in over 2041. The death Use synonyms
number
is projected to hit around 65.000 in 2061 before remaining stable in the next four decades.Use synonyms