
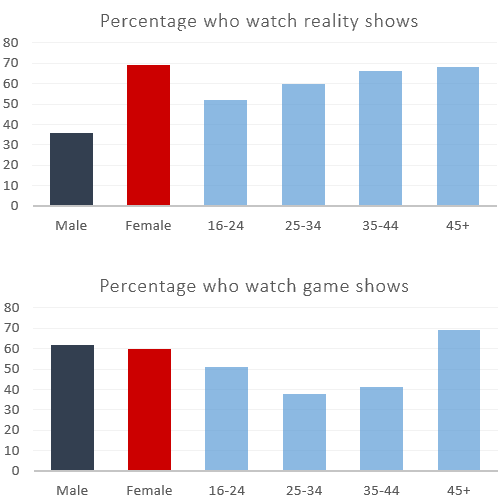
The bar graphs illustrate data on two categories of television programs (reality and game shows) that are watched by males and females of different age groups (16-24, 25-34, 35-44 and 45+) in Australia. The information is represented in percentage form.
Overall
, we see that more women watch reality shows than men, with there being an increasing interest in these programs as the age of the population grows. In terms of game shows, both sexes are equally interested in them, with the oldest group of the population being keener on them than others.
As far as reality shows are concerned, 35% more women than men watch them. Linking Words
Additionally
, there is a growing interest in these shows as people grow older from 16 to 45+, which is around 51%, 60%, 66% and 69% respectively in the four given ranges.
Linking Words
On the other hand
, almost equal percentages of males and females watch game shows (i.e 60% and about 59% respectively). Over and above that, Linking Words
while
other age groups view these programs in the range of 50% to 39%, the oldest group of 45+ years is the most engrossed with them with 70% of the population tuning in.Linking Words