
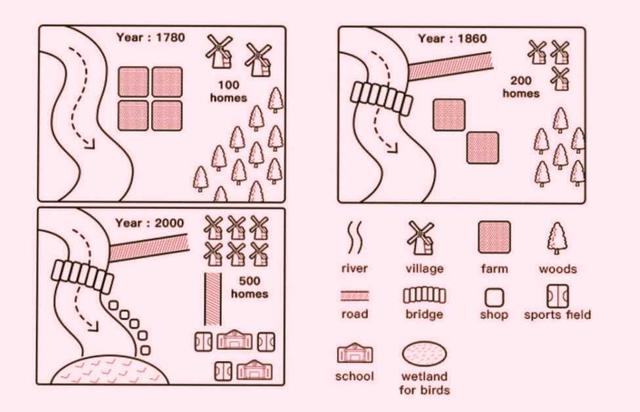
The maps illustrate how a city called Willington has developed over a period of 220 years.
Looking from an
overall
perspective, it is readily apparent that the city witnessed dramatic changes with regard to the construction of new roads, facilities, and residential areas.
In the first map, in 1780, a river was located to the west of the locality and woodland was sited in the southeast. In the middle of the region, a farm was placed and houses were built in the northwest corner of the town.
In comparison, a bridge was constructed over the stream in 1860 and a road was paved which was running from the river to the villages. Linking Words
Moreover
, in 1860, 100 houses were built in the residential area and many trees in the forest were chopped down for it. One-half of the farmland was demolished in order to build a road and several homes.
In 2000, a wetland for birds was developed to the south of the river and a commercial area was constructed on the southeast border of the watercourse. Linking Words
Also
, 300 homes were Linking Words
additionally
constructed in the village and a new road was paved from the outskirts to the territory where schools and sports fields were located. The jungle was completely cut down and replaced with sports fields and schools and the farm zone was removed.Linking Words