
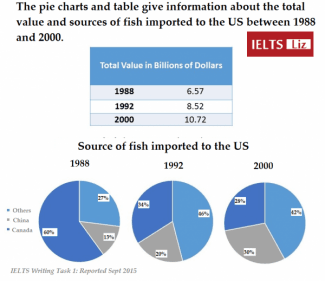
The table and pie chart illustrates the change in
value
and sources of Use synonyms
fish
imports to the United Kingdom between 1990 and 2000. Use synonyms
It is clear that
the Linking Words
value
of Use synonyms
fish
had risen and the main importing Use synonyms
countries
were Japan Use synonyms
as well as
Canada during Linking Words
this
period.
In the past, Canada played a significant role in the sources of Linking Words
fish
Use synonyms
in contrast
to other Linking Words
countries
was the second-largest importer to the United Kingdom in 1990. Use synonyms
Although
Japan was the second main import country, it totally imports less than other Linking Words
countries
. Use synonyms
Additionally
, the figure for Linking Words
fish
was only 6.5 Use synonyms
billion
Use synonyms
pounds
in 1990.
At the beginning time of Use synonyms
this
period, the total Linking Words
value
of Use synonyms
fish
imports had gradually risen from 6.5 Use synonyms
billion
Use synonyms
pounds
to 7.05 Use synonyms
billion
Use synonyms
pounds
. At the same time, other Use synonyms
countries
become the main importers of Use synonyms
fish
in 1995. We can see that there was a dramatic increase in the Use synonyms
value
of Use synonyms
fish
products, by around 3 Use synonyms
billion
Use synonyms
pounds
, in the next five years. Use synonyms
Also
, the second-highest importer of Linking Words
fish
was replaced by Japan in 2000.Use synonyms