
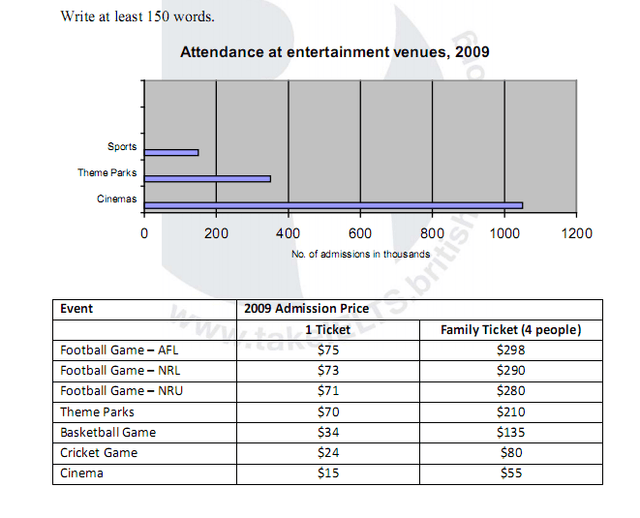
The given chart provides data regarding the number of people participating in several types of events in 2009,
as well as
the participation fees.
Linking Words
Overall
, data suggests that in 2009 Linking Words
sports
venues were the least participated in, Use synonyms
while
people attended cinemas the most. Linking Words
Additionally
, the prices of singular and family tickets were the highest for Linking Words
sports
games and lowest for the cinema.
Use synonyms
According to
the information given, cinemas had a significantly larger number in comparison to the other venues, with a little over 1000 admissions. In opposition, amusement parks reached barely 400 and Linking Words
sports
games a little less than 200 tickets. Tickets for singular people were the lowest at the cinema, at 15$ per. For certain Use synonyms
sports
games admission was no more than 34$, Use synonyms
however
, access to the theme parks and football matches was all above 70$. Prices for family, or rather, group access followed similar trends, with the AFL match landing the highest price.Linking Words