The table and charts below give information on the police budget for 2017 and 2018 in one area of Britain. The table shows where the money came from and the charts show how it was distributed. Summarise the information by selecting and reporting the main features, and make comparisons where relevant.

The table and charts below give information on the police budget for 2017 and 2018 in one area of Britain. The table shows where the money came from and the charts show how it was distributed.

Summarise the information by selecting and reporting the main features, and make comparisons where relevant.
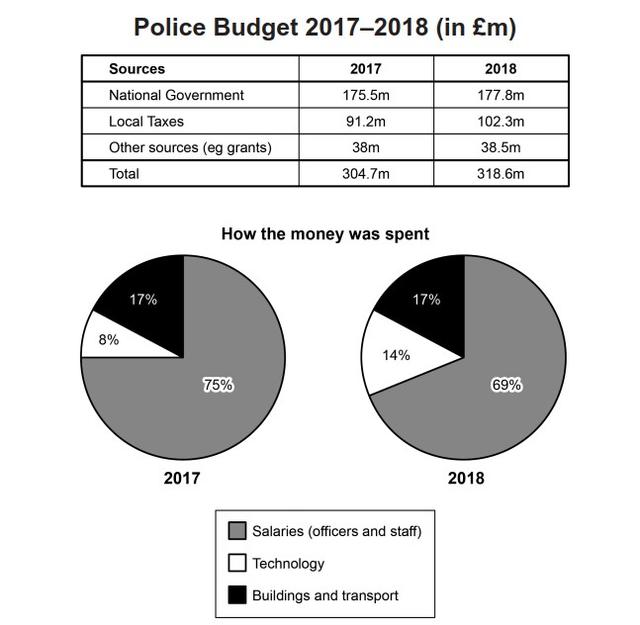
The pie chart and table show data regarded the policy finances in 2017 and 2018 in a place of UK. The table describes the voices of expenditure and the pie chart illustrates the amount of money which is obtained from different sources.
Overall
,
it is clear that
the total resources which are invested in policy increased over these two years and salaries represented the majority part of policy costs in
this
period.
To begin
, there were few changes in the expenditure of money which was given to police between 2017 and 2018. The most dramatic increase of ten million came from Local Taxes which remained the second principal source for these two years.
While
National government gave the bigger finance for both years, rising slightly the figure to 177.5 m in 2018.
On the other hand
, the police took a few different choices regarding how their finances were split. In fact, it increased the proportion of resources for technology from 8 per
cent
to 14 per
cent
between 2017 and 2018. At the same time, Building and transport remained constantly in finance for over the time frame (17 per
cent
) and salary dropped by 14 per
cent
.
Submitted by cimbo95 on

Unauthorized use and/or duplication of this material without express and written permission from this site’s author and/or owner is strictly prohibited. Excerpts and links may be used, provided that full and clear credit is given to Writing9 with appropriate and specific direction to the original content.

Vocabulary: Replace the words cent with synonyms.
Vocabulary: The word "chart" was used 2 times.
Vocabulary: The word "table" was used 2 times.
Vocabulary: The word "give" was used 2 times.
Vocabulary: The word "increase" was used 2 times.
Vocabulary: The word "remained" was used 2 times.
Topic Vocabulary:
  • Fiscal allocations
  • Revenue streams
  • Budgetary oversight
  • Expenditure
  • Financial appropriation
  • Government grants
  • Local taxation
  • Operational costs
  • Capital investment
  • Public safety
  • Crime prevention
  • Community policing
  • Resource allocation
  • Year-on-year comparison
  • Budgetary constraints
  • Fiscal year
  • Fund disbursement
  • Budget deficit/surplus
  • Trend analysis
  • Financial sustainability
  • Law enforcement funding
What to do next:
Look at other essays: