
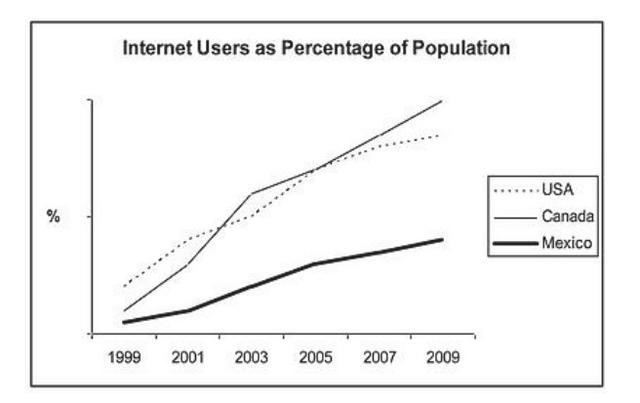
The graph illustrates the data about some
internet
users in three countries from 1999 to 2009. The data shown is used as Use synonyms
Use synonyms
percentage
in the Correct article usage
a percentage
USA
, Canada and Mexico. Use synonyms
Overall
, it can clearly be seen that most of the Linking Words
internet
users are in Canada and the Use synonyms
USA
, Use synonyms
while
the least Linking Words
percentage
is in Mexico.
First of all, the Use synonyms
percentage
of people using the Use synonyms
internet
in the Use synonyms
USA
during 1999 started at a low Use synonyms
percentage
, but it started to go up gradually year by year. In 2003 the Use synonyms
percentage
dropped slightly. After Use synonyms
that
it began to rise again to reach the Add a comma
,that
heighest
point in its form in 2009. Correct your spelling
highest
Then
, in Mexico, the ratio of Linking Words
the
Correct article usage
apply
internet
consumers in 1999 was the lowest one among the other two countries. By far, it kept climbing having some downs until 2009 staying Use synonyms
the
lowest Change preposition
at the
percentage
Use synonyms
according to
the other countries.
Linking Words
On the other hand
, the Linking Words
USA
had the highest probability in 1999 and had a hold on it till 2003 when it fell significantly, but Use synonyms
returning
to jump to get a high Wrong verb form
returned
percentage
Use synonyms
at the end
of 2009.Linking Words