
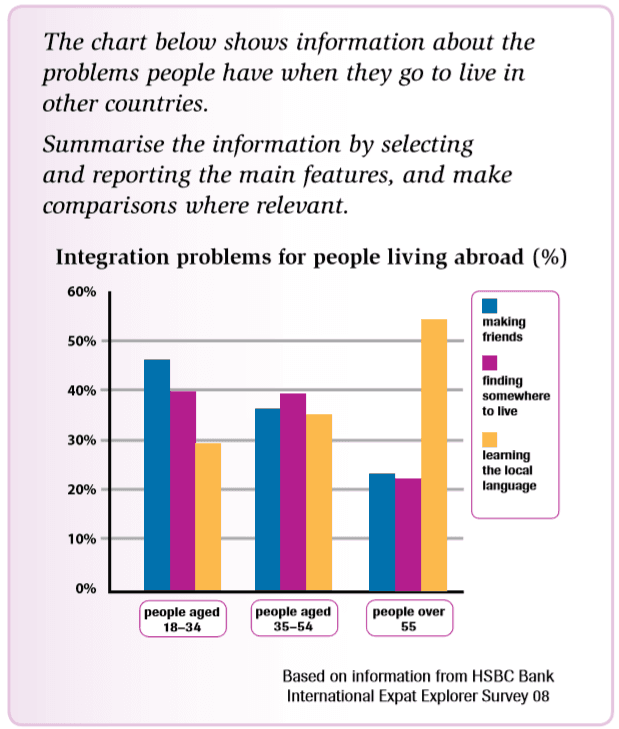
The bar chart illustrates the number of problems faced by
people
during transfer to the other country depending on a different Use synonyms
age
.
The old Use synonyms
people
above 55 years old show a higher value above 50% with the new language in that country .Where the adult Use synonyms
age
is between approximately 35% and the younger little one.
Use synonyms
according to
social life and making new friends the bar shows 40% of ages between 18-34 and Linking Words
also
adult Linking Words
people
may seem to be equal to each other ,but for older ,Use synonyms
people
its complicated may just reach 22%.
Use synonyms
on the other hand
, when looking for accommodation will see that younger and adult Linking Words
people
may face a higher per cent between 38% to 40% ,and for older ,Use synonyms
age
it may easily and little difficult about 20% .
in conclusion , the high level of that complicated my face the older Use synonyms
age
in the language and making friends, on the other ,hand easy to find a place in the country with them.Use synonyms