
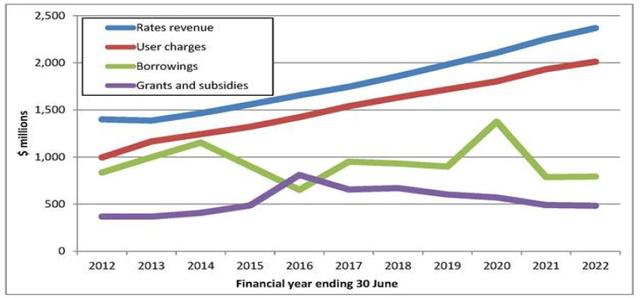
The above line graph illustrates the details of the total finances of a particular regional government in Newzealand for the time period of 10 years (2012-2022). The values are calibrated in
million
Use synonyms
dollars
.
Use synonyms
Overall
, The values for Rates revenue remained the highest and showed upward inline throughout ten years. Linking Words
In contrast
to Linking Words
this
, Grants and subsidies were minimal from 2012 to 2022.
Linking Words
While
studying the graph thoroughly,it is seen that Rates revenue cost Linking Words
initially
less than 1,500 Linking Words
million
Use synonyms
dollars
in 2012 Use synonyms
then
raised to around 2,500 Linking Words
million
Use synonyms
dollars
in 2022. Use synonyms
Although
Grants and subsidies contributed the least part in finances with a value of fewer than 5,000 Linking Words
million
Use synonyms
dollars
to exact 5,000 Use synonyms
dollars
from 2012 to 2022.
Use synonyms
Besides
, Borrowings remained the same throughout ten years with a value of about 900 Linking Words
million
Use synonyms
dollars
. Use synonyms
Moreover
, User charges showed an inclination from 1,000 Linking Words
million
Use synonyms
dollars
in 2012 up to 2,000 Use synonyms
million
Use synonyms
dollars
in 2022.Use synonyms