
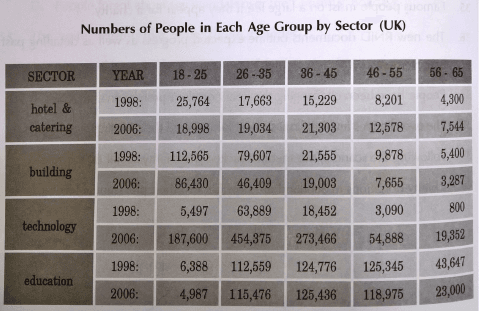
The table provides information on how many public are employed in various jobs in the UK based on their
age
. There are mainly 4 Use synonyms
age
groups and sectors given.
The young crowd aged between 18-25, was mostly employed in buildings back in 1998 but in 2006, the situation changed completely as the highest number of young employees are from the technology section. Within an 8-year period of time, Use synonyms
a
number of young Change the article
the
community
engaged in technology increased significantly. When it comes to hotel and catering and technology-related occupations, despite the Fix the agreement mistake
communities
age
amount of involvement increased in 2006 compared to their respective 1998 values Use synonyms
whereas
, the building section indicates an opposite trend in all Linking Words
age
groups.
In 2006,the highest number of people occupy in technology are from the 26-35 Use synonyms
age
group Use synonyms
while
the least is from 56-65. Even though the count of people who work in education-related jobs fluctuated over the given time period , the highest value for 2006 which is 125,436 is from the 36-45 Linking Words
age
group.Use synonyms