
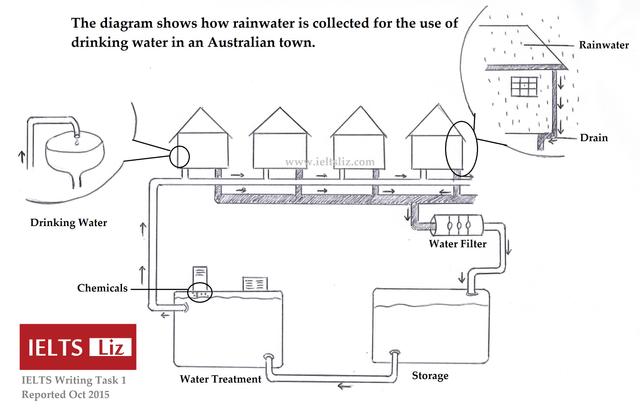
The flowchart depicts all the necessary steps for drinking
water
in Australia. Those processes will be divided into two main steps: producing filtering Use synonyms
water
and drinking Use synonyms
water
.
The whole production Use synonyms
is
started Unnecessary verb
apply
with
collecting rainwater from every Australian household in the drain. Change preposition
by
Initially
, before Linking Words
Add a missing verb
being filtered
filtered
, Wrong verb form
filtering
water
needs to be delivered by Use synonyms
drain
which is located in the ceiling and soil. Filtration is one of the crucial actions to filter any contamination. After Add an article
a drain
filtered
, Wrong verb form
filtering
water
gets to be stored in the storage machine to be processed Use synonyms
further
.
In the subsequent stage, Linking Words
water
should be transported by pipes and treated by Use synonyms
Use synonyms
water
treatment machine to destroy any chemical molecules in order to security and safety in society. Afterwards, Add an article
a water
water
is delivered to every household through specific pipes. Eventually, Use synonyms
water
is ready to be consumed by every Australian. Use synonyms
This
technology helps people to improve their drinking habits and prevent any diseases Linking Words
such
as diarrhoea and thymus.Linking Words