
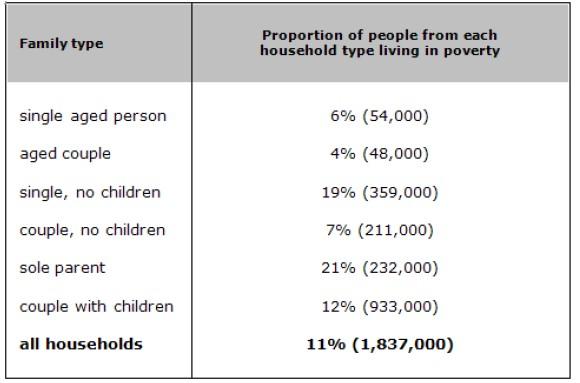
The provided chart displays different types of Australian poor families in 1999.
Overall
, what stands out from the chart is the fact that the poorest kind of household is represented by the sole parents. Linking Words
On the contrary
, the less poor are the aged couple.
Let's take a look at the data in detail. As regards Linking Words
the
singles, there are three kinds of individuals without partners. The single aged person is the wealthier category among them, in Correct article usage
apply
fact
it represents only 6% of the households living in poverty. Add a comma
,fact
Then
, singles without kids Linking Words
are
359,000 Unnecessary verb
apply
Linking Words
similarly
to the single parents that have the highest percentage Change the word
similar
showed
by the table.
Let's have a look at the couples. The aged couples are the richest, reaching 4%. The partners that decided not to have babies Wrong verb form
shown
are
211,000 Unnecessary verb
apply
while
the number of poor parents that aren't divorced is higher, namely 12%. In general, all households Linking Words
that
live in miserable conditions in Australia are 11%.Correct pronoun usage
apply