
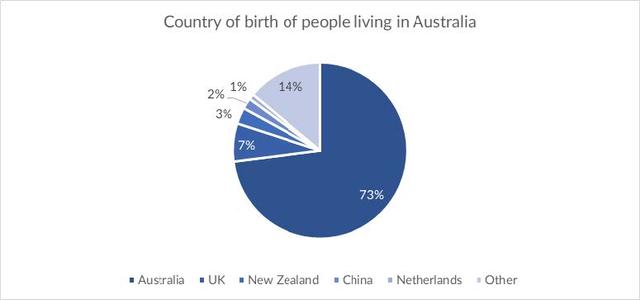
The pie chart illustrates the country of birth of
people
residing in Use synonyms
Australia
. and the table describes where Use synonyms
people
live in a rural area or city area depending on the delivery of these countries.
The most impressive from the board is Use synonyms
Australia
is the highest leading country. At the same time, the Netherlands is the least country with birth Use synonyms
people
living in and Use synonyms
on the other hand
, the majority of Linking Words
people
preferred to live in cities area than in rural areas.
The pie chart shows that almost three-quarters of the total population is born in Use synonyms
Australia
, and only 7% were born in the UK. New Zealand, China, and the Netherlands born are between 3% and 1%.
The table shows where the population of Use synonyms
Australia
lives. Use synonyms
People
born outside of Use synonyms
Australia
and New Zealand have the highest percentage of the population moving to cities, about 66% and 60% Use synonyms
while
they count the highest percentage of Linking Words
people
living in rural areas among others, 17% and 20% respectively. Chinese reached the highest peak of 99% of them settling in cities.Use synonyms