
The chart gives information regarding
to
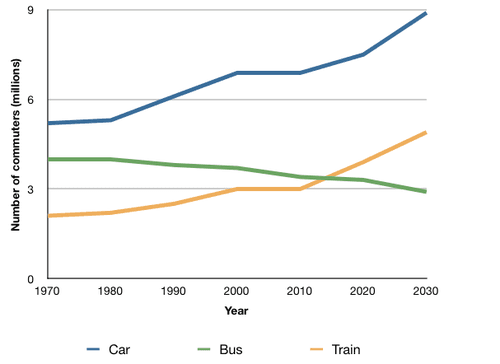
England citizens' everyday trips by three specific types of vehicles from 1970 to 2030.
We can see the personal automotive rose steadily from just over 5% in 1970 to a peak of roughly 9% by 2030.Remove the preposition
apply
However
,looking at bus use,we see the most trip accrued by van was in1970 just over 2% and Linking Words
then
a steady decline to 3% in 2030, UK people that travel by train consist rose almost upper 2% in 1970 and will receive over 5% in 2030.
Regarding Britain's automotive users, appears Linking Words
this
kind of travelling start popularity in 1980 whit 5% and had nearly sharp growth until 2000 after a bit of a rate decline and Linking Words
then
is expected to continue an upward trend , the train daily passengers show an increase after between 2000 to 2010 that had fix ratio and is shown to it s own peak by 2030. the bos user of trips decrease gradually from 1980 to Linking Words
this
day and Linking Words
then
expected to fall until 2030.
In summary, predicted that individual automotive users Linking Words
besides
train travellers gradually rise Linking Words
in contrast
with people that like a select bus for daily distance passes.Linking Words