The chart below show the result of a survey of adult education. The first chart shows the reasons why adults decide to study. The pie chart shows how people think the costs of adults education should be shared. Write a report for a university lecturer, describing the information shown below. The chart below show the result of a survey of adult education. The first chart shows the reasons why adults decide to study. The pie chart shows how people think the costs of adults education should be shared. Write a report for a university lecturer, describing the information shown below.

The chart below show the result of a survey of adult education. The first chart shows the reasons why adults decide to study. The pie chart shows how people think the costs of adults education should be shared.

Write a report for a university lecturer, describing the information shown below.

The chart below show the result of a survey of adult education. The first chart shows the reasons why adults decide to study. The pie chart shows how people think the costs of adults education should be shared.

Write a report for a university lecturer, describing the information shown below.
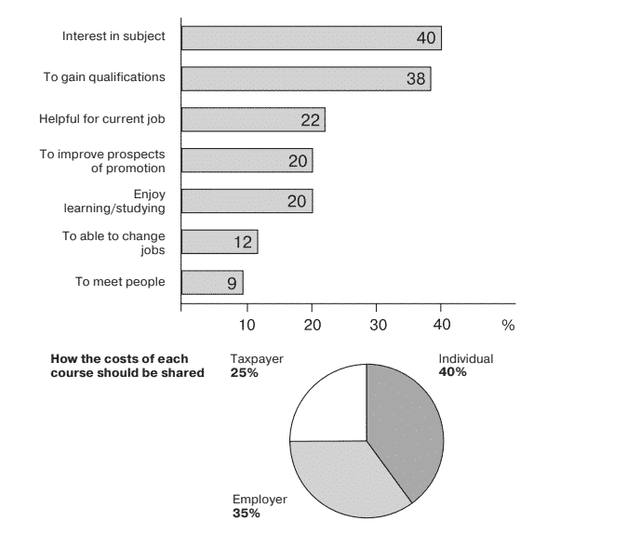
The graphs illustrate a number of details, which were received during the survey among the population. The bar chart summarizes the factors that caused adults to continue their learning ,
whereas
the pie chart informs about public opinion regarding the cost-sharing for adult education . It can be clearly seen that the most common reason why adults decide to study is interest in the program, the percentage of
this
reached 40%. Obtaining qualifications is the second most prevalent cause of learning among the mature. If the latter accounts for 40%,
then
the former is only 2% less. Out of 100, 22 learners find education helpful to their current job.
Moreover
, reasons like enjoying studying as popular as improving prospects of promotion, both of them are one-fifth of the total.
Nevertheless
, a meagre number of students, 12% and 9% feel that studying would assist them to secure a new job and that it will build acquaintances with new people.
According to
the survey, the pie chart’s largest sector, 40%, represents the people who think that individuals should pay for their studies. As opposed to the first group of people, the other 35% of society state that the employers and the remaining quarter that taxpayers should pay the cost of the adult study.
Submitted by medetbaevaa13 on

Unauthorized use and/or duplication of this material without express and written permission from this site’s author and/or owner is strictly prohibited. Excerpts and links may be used, provided that full and clear credit is given to Writing9 with appropriate and specific direction to the original content.

Vocabulary: The word "chart" was used 3 times.
Vocabulary: The word "number of" was used 2 times.
What to do next:
Look at other essays: