The line graph below shows the changes in the share price of Outokumpu companies in euros between January 2006 and December 2010. Write a report for a university lecturer describing the information below.

The line graph below shows the changes in the share price of Outokumpu companies in euros between January 2006 and December 2010.

Write a report for a university lecturer describing the information below.
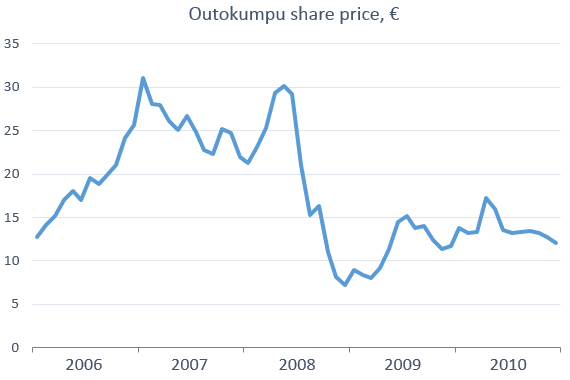
The line chart below illustrates the changes in the value of Outokumpu shares in euros between January 2006 and December 2010 In general, during
this
four-year period, the start was good and the company shows excellent results, the shares rose and sometimes fell, but it was not critical,
but
Correct word choice
and
show examples
after a few years, the share
price
of Outokumpu remains unchanged. In the period 2006-2007, Outokumpu companies reached a peak in the share
price
- from 12.5 to 32 euros.
However
, after 3.5 years, the
price
returned to the starting point. As can be seen from the graph, in the period from 2007 to 2008, the linear graph moved up, and
then
sharply decreased in
price
to 6.5 euros, during 2009 the
price
tried to increase. Meanwhile, the share
price
in 2010 returned to its original value.
Submitted by dnm.best on

Unauthorized use and/or duplication of this material without express and written permission from this site’s author and/or owner is strictly prohibited. Excerpts and links may be used, provided that full and clear credit is given to Writing9 with appropriate and specific direction to the original content.

Common mistake: Your writing should be 150-250 words.
Basic structure: Change the fifth paragraph.
Vocabulary: Replace the words price with synonyms.
Vocabulary: Rephrase the word "changes" in your introduction.
Vocabulary: The word "graph" was used 2 times.
Vocabulary: Use several vocabularies to present the data in the fifth paragraph.
What to do next:
Look at other essays: