
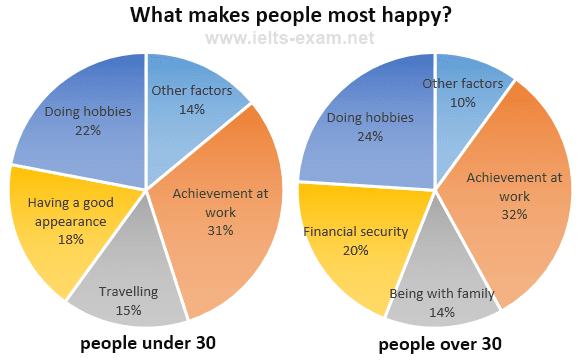
The Pie Chart depicts the results of a survey about activities which provide happiness to different age groups.
Overall
, it can be seen that both age groups above 30 and below 30 enjoy when they complete an achievement at work and when they perform actions related to their hobbies.
Linking Words
Furthermore
, looking into details, 15% of the folk under 30 enjoy Travelling Linking Words
whereas
approximately the same percentage of older people feel happy when they are with the family. Linking Words
Moreover
,when older folks have Financial Security Desposits, it makes 20% of them happy. Linking Words
Additionally
,18% of youngsters like to have a good appearance.
Linking Words
in contrast
, 32 and 31 per cent of people above 30 and under 30 feel jolly when they accomplish a big target in their professional life respectively. 24% of elders, only 2% less than youngsters, feel joyful when they are performing their hobbies.there are many miscellaneous activities which make up 10% of elders and 14% of youngsters but it is obvious that most people love it when they accomplish an achievement in office or in a businessLinking Words