
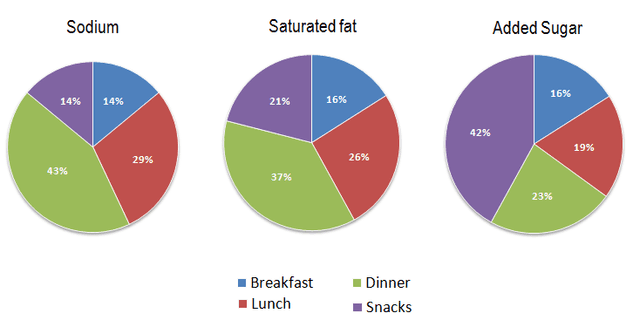
The pie chart illustrates information about the ratio of snacks of three different kinds of nutrients, which are not good for health if consumed in higher quantity.
Overall
, what stands out from the chart is that most of the crowd intake Linking Words
sodium
Use synonyms
while
eating supper. Linking Words
whereas
, most carbohydrate is consumed by people Linking Words
while
eating snacks. Linking Words
Likewise
, most of the saturated fat is absorbed by the population Linking Words
while
eating banquets.
In the detail, almost 43% of Linking Words
sodium
, saturated fat and added carbohydrate are consumed by people Use synonyms
while
eating feast. Linking Words
Moreover
, around 42% of added carbohydrates, saturated fat and Linking Words
sodium
are intakes by crowds Use synonyms
while
eating snacks. Linking Words
On the other hand
, not so far from 29% of Linking Words
sodium
, saturated fat and added sugar is absorbed by the population Use synonyms
while
having lunch. Linking Words
Whereas
, prior to 16% of added carbohydrates, Linking Words
sodium
and saturated fat are eaten by folks Use synonyms
while
having breakfast.
Linking Words
However
, there was an upward gradual trend in people in all these three nutrients Linking Words
while
eating banquet.Linking Words