
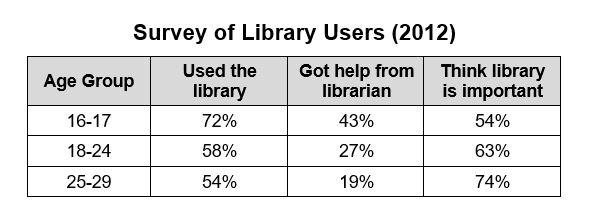
The table indicates the rate of users' aims upon three categories and the bar chart reveals the rate of reasons why individuals used the library in terms of three age groups in 2012.
Overall
, older people thought the book room was important for them. and a few of them chose to get help from a librarian. The 16 to 17 years old individuals were the most frequent group who used the library. Linking Words
Furthermore
, there was an upward in the fields of research and borrowing books, Linking Words
whereas
the newspapers-borrowing experienced a downward trend with the age growing.
With regards to the first picture, 74% of people aged from 25 to 29 thought the library was important, compared to the lowest rate of 19% of them tended to ask for help from a librarian. And 72% of the 16 to 17 years old group used the book room the most.
Turning to the bar graph, in the proportion of research, the 16-17-year-old group was the highest, peaking at approximately 54%, followed by 18 to 24 and the 25 to 29 age bracket, at roughly 45% and around 40% respectively. Linking Words
Then
, the figure fell by more than 5% each in borrowing books among the three generations. Exactly 20% of 16-17 people were at the bottom.Linking Words