
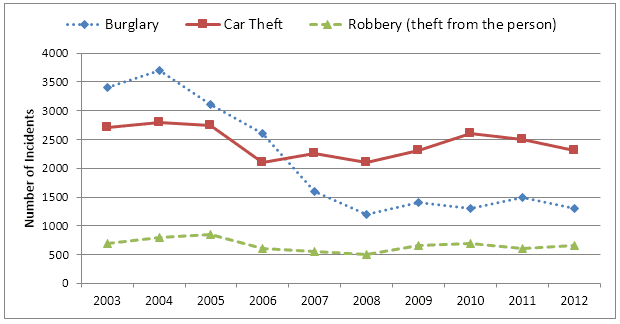
The line graph gives information about the changes in three various areas of crime, burglaries, car thefts and robberies, in Newport city centre, close to a decade between 2003 and 2012.
In general, what could be highlighted from the chart is that the number of crime incidents in the inner city decreased remarkably. Another interesting point is that the
quantity
of robberies, Change the quantifier
number
thefts
from the person, remained stable during the observed period.
Looking at the details, as regards burglaries, it started at less than 3500 incidents in 2003, reached a peak in 2004 and Correct word choice
and thefts
then
experienced a gradual drop during the remaining period. Concerning car thefts, Linking Words
it
started Correct pronoun usage
they
at
2800 occasions, fell slightly in 2006 and Change preposition
on
then
soared to 2700 Linking Words
on
2012.
Change preposition
in
By contrast
, the number of robberies remained constant during the given period. Despite being stable all the observed time, it experienced a slight reduction in 2008 and Linking Words
then
grew up slowly.Linking Words