
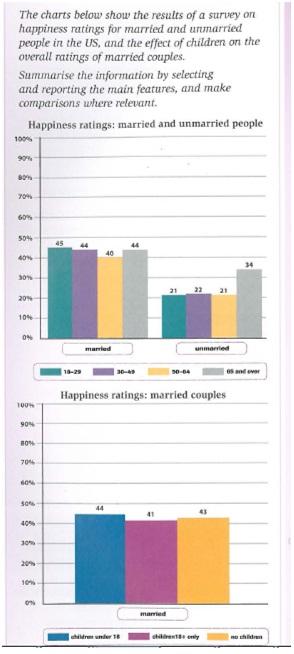
The bar
chart
shows the percentage of Use synonyms
people
who are happy in the United States. The first one divides Use synonyms
people
into age Use synonyms
groups
and marital status. The second Use synonyms
chart
demonstrates how Use synonyms
children
impact the rating of happiness in married couples.
Use synonyms
According to
the first Linking Words
chart
, the amount of enjoyment in married Use synonyms
groups
fluctuates between 40 and 45 per Use synonyms
cent
. The 18-29, 30-49 and 65 and over Use synonyms
years
old Use synonyms
groups
have the most significant percentage of happiness which is between 44 and 45 per Use synonyms
cent
. Use synonyms
While
the first three Linking Words
groups
of unmarried Use synonyms
people
have the lowest statistic in the range of 21 and 22 per Use synonyms
cent
. Use synonyms
Although
, the Linking Words
last
unmarried group of Linking Words
people
which is 65 and over Use synonyms
years
old has a compelling difference of 12 per Use synonyms
cent
approximately from previous Use synonyms
groups
.
The second bar Use synonyms
chart
demonstrates the rating of happiness in married couples with Use synonyms
children
. The happiest group is represented by Use synonyms
people
who have Use synonyms
children
under 18 Use synonyms
years
old with 44 per Use synonyms
cent
. Other Use synonyms
groups
have a similar percentage. Use synonyms
People
with only one child over 18 Use synonyms
years
old have 41 per Use synonyms
cent
, and the group of couples with no Use synonyms
children
has 43 per Use synonyms
cent
.
Use synonyms
Overall
, we can clearly see that married Linking Words
people
are happier than unmarried with regard to the fact whether they have Use synonyms
children
or not.Use synonyms