
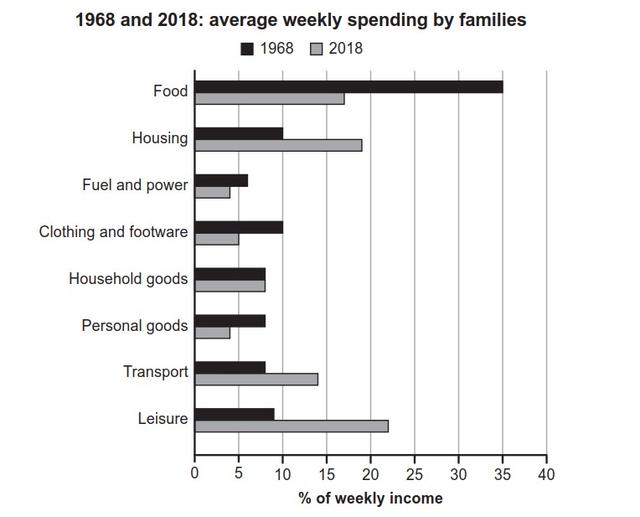
The chart illustrates data about how household spent their revenue in 1968 and in 2018 in one country.
In general, it is clear to indicate that, people used most of their profit on food in 1968
whereas
, the amount of money spent on fuel and power was the least in 2018.
In 1968, the average weekly spending by the house on food was 35% Linking Words
while
in 2018 the weekly wage used on food was approximately 22%. Linking Words
On the other hand
, housing utilized 10% in 1968 and in 2018 the weekly cash on housing was recorded by almost 20%. Linking Words
However
, fuel and power weekly pay for both 1968 and 2018 was approximately 7% and 4% respectively.
Linking Words
Moreover
, in 1968 the families' average weekly money used on clothing and footwear was 10% Linking Words
then
reduced to 5% in 2018 Linking Words
while
household goods remained constant for both years Linking Words
thus
7%. Linking Words
In addition
, personal goods salary usage in 1968 stood at 7% and later decreased steadily to 4% in 2018. Transport weekly proceeds were 8% in 1968 Linking Words
then
rose dramatically to almost 15% in 2018 Linking Words
while
leisure recorded 9% in 1968 and increased sharply to 22% in 2018.Linking Words