
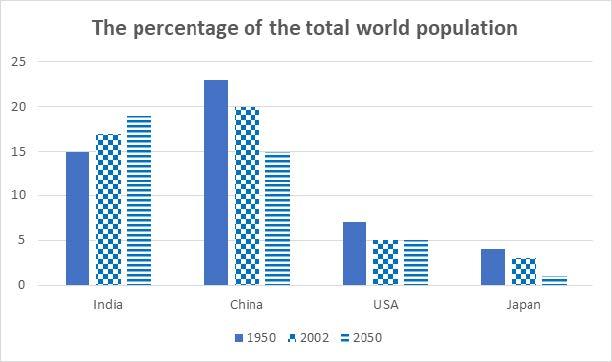
The bar chart depicts the percentage of the total
world
Use synonyms
population
in 4 different countries over 100 years starting from 1950.
Use synonyms
Overall
, it is evident that the statistics for the earth's Linking Words
population
decreased for all countries except for Use synonyms
India
. It is Use synonyms
also
noticeable that Linking Words
India
was the only country where the capacity of the Use synonyms
world
Use synonyms
population
is expected to increase by 2050.
Looking at the graph in more detail, in 1950 and 2002, China made up the greatest proportion of the Use synonyms
world
Use synonyms
population
despite a slight fall in its figures from approximately 23% to 20%. An akin situation could be noticeable in the rate of the Use synonyms
world
populace in Japan and the USA. Their data experienced a decline in the Use synonyms
population
of around 2% over the same period, with figures at around 2,5% and 5% respectively. Use synonyms
In contrast
, the opposite could be seen in Linking Words
India
, where the figure sharply grew by around 15% from 1950 to 17% in 2002.
Use synonyms
On the other hand
, in 2050, the figures for China and Japan are predicted to have a steep fall of around 15% and 2% respectively, whilst the figure for the USA is likely to remain unchanged, at 5%. Meanwhile, the proportion of residents residing in Linking Words
India
is projected to continue rising to 19%Use synonyms