
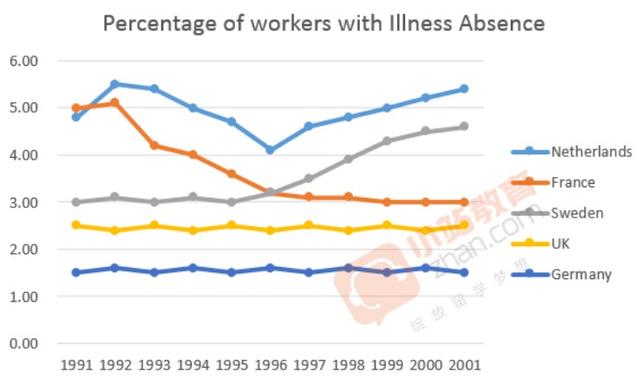
The bar graph gives information about absenteeism in workers for a day or more
due to
illness in the Linking Words
Netherlands
, Use synonyms
France
, Use synonyms
Sweden
, the Use synonyms
Uk
and Germany from 1991 to 2001.
It can be noted that the percentage eventually increased for the Use synonyms
Netherlands
and Use synonyms
Sweden
. Use synonyms
On the other hand
, Linking Words
France
was the only country where the number decreased significantly. Use synonyms
Moreover
, The Linking Words
UK
and Germany Use synonyms
was
stable throughout the period.
In Germany, a mere 1.5% of the employees called in sick, which remained unchanged from the year 1991 to 2001. Change the verb form
were
However
, the Linking Words
UK
and Use synonyms
Sweden
had 2.5% and 3% of sick leave rates which never changed for the Use synonyms
UK
throughout the years but surged drastically to approximately 4.5% for Use synonyms
Sweden
.
Use synonyms
In addition
, Linking Words
France
and the Use synonyms
Netherlands
had the highest data of about 5%. It declined considerably to 3% for Use synonyms
France
but escalated sharply to almost 5.5% for the Use synonyms
Netherlands
with some fluctuations in between.Use synonyms