
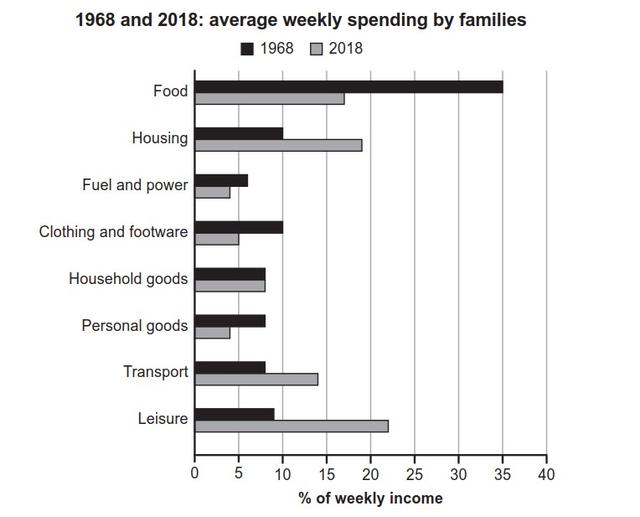
The graph illustrates the average weekly speeding by families in a particular country during the period of time from 1968 to 2018.
Overall
, the percentages of weekly income spent on housing, transport and leisure increased Linking Words
while
the proportions of money used on food, fuel and power, clothing and footwear and personal goods decreased. Only the figure for house goods was kept at the same level.
Linking Words
To begin
with, it is evident that the percentages of weekly salaries spent on food, clothing and footwear and personal goods dropped significantly from 35%, 10% and 7.5% in 1968 to 16%, 5% and 4% in 2018 respectively. Meanwhile, the figure for fuel and power decreased by around 2%. Linking Words
On the other hand
, the proportion of income used on housing, transport and leisure rose dramatically from 10%, 6% and 8% in 1968 to 18%, 14% and 23% in 2018 respectively. What is worth mentioning is that the money paid to households remained the same at around 6%.Linking Words