
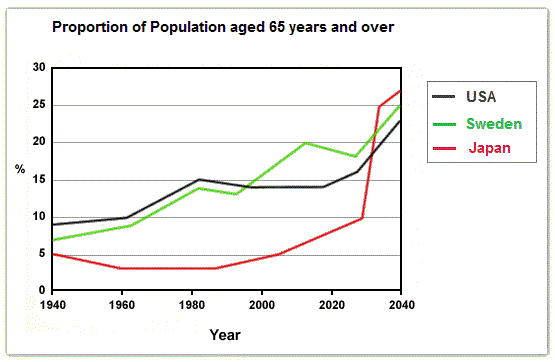
The line graph illustrates the
percentage
of the Use synonyms
population
over 65 between 1940 and 2040 in the three various countries. Use synonyms
Overall
, there were substantial upward trends in the Linking Words
percentage
of senior citizens above 65 in three developed countries. Another interesting point is that the Use synonyms
USA
had a higher Use synonyms
percentage
of old Use synonyms
people
in 1980, but in 2040, Japan will likely have dramatically grown more than others.
In the beginning, the portion of Use synonyms
people
aged 65 and over in the Use synonyms
USA
noticeably rose during the first 40 Use synonyms
years
. After the peak moment in 1980, the Use synonyms
percentage
of the Use synonyms
USA
witnessed a gradual slump till 2018. Starting with 13 per Use synonyms
cent
in 2018 there was a remarkable increase, which is predicted that the Use synonyms
USA
will show 25 per Use synonyms
cent
of the aged Use synonyms
population
in 2040. Meanwhile, Use synonyms
Sweden
maintained the same level of old Use synonyms
people
in the first 20 Use synonyms
years
. As the Use synonyms
USA
dates, Use synonyms
Sweden
saw an unexpected growth till the 15 in 1980. After the short period of decrease, which lasted over 30 Use synonyms
years
, it witnessed a sharp increase to 20 per Use synonyms
cent
. Nowadays the graph of Use synonyms
Sweden
demonstrates the drop, but it is predicted that the Use synonyms
percentage
of the old Use synonyms
population
in Use synonyms
Sweden
will overtake the Use synonyms
USA
in 2040.
In the end, the share of aged 65 Use synonyms
people
in Japan saw a considerable increase over the 20 Use synonyms
years
and between 1960 and 1980 it stood at 3 per Use synonyms
cent
. Use synonyms
Then
the Linking Words
percentage
of the old Use synonyms
population
in Japan witnessed a sharp growth to 10 per Use synonyms
cent
. It is expected that the proportion of aged Use synonyms
people
will show a higher Use synonyms
rise
than others in 2040.Correct your spelling
risk