
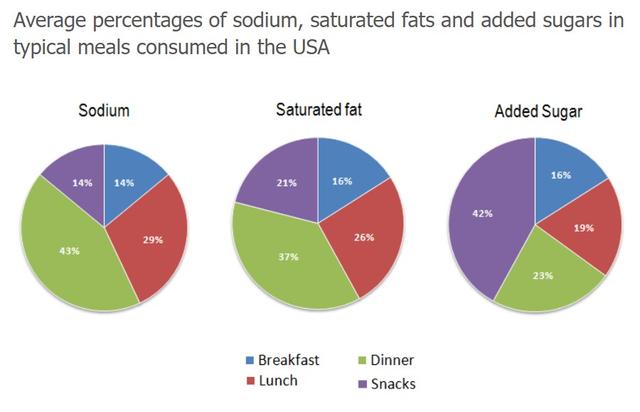
These three pie charts illustrate how much
sodium
, saturated fat, and added Use synonyms
sugar
content in four types of meals. Namely, in Use synonyms
breakfast
, lunch, Use synonyms
dinner
, and Use synonyms
snacks
.
At the first glance, Use synonyms
dinner
has the highest content of Use synonyms
sodium
and saturated fat, Use synonyms
while
Linking Words
snacks
have a majority of Use synonyms
sugar
. Use synonyms
On the contrary
, the smallest percentage of nutrients is found consistently in Linking Words
breakfast
.
When we look at the data in detail, saturated fat and Use synonyms
sodium
portion are almost identical across four meals. For saturated fats number, the largest is at Use synonyms
dinner
with 43%, followed by lunch with 35%, 26% in Use synonyms
snacks
, and Use synonyms
breakfast
as lowest as 16% ,Use synonyms
meanwhile
Add a comma
,meanwhile
sodium
levels only differed in the Use synonyms
snacks
and Use synonyms
breakfast
categories. They have the exact same value of 14%.
Use synonyms
Moreover
, added Linking Words
sugar
chart has the most contrast profile. As stated before, Use synonyms
snacks
have the biggest content of Use synonyms
sugar
as high as 42%, Use synonyms
then
it is 23% at Linking Words
dinner
, 19% at lunch and at Use synonyms
breakfast
only amount to 16%.
In conclusion, they are different amounts of Use synonyms
sodium
, fat, and Use synonyms
sugar
in four meals.Use synonyms