
The table gives detailed data about the total number of factories,
as well as
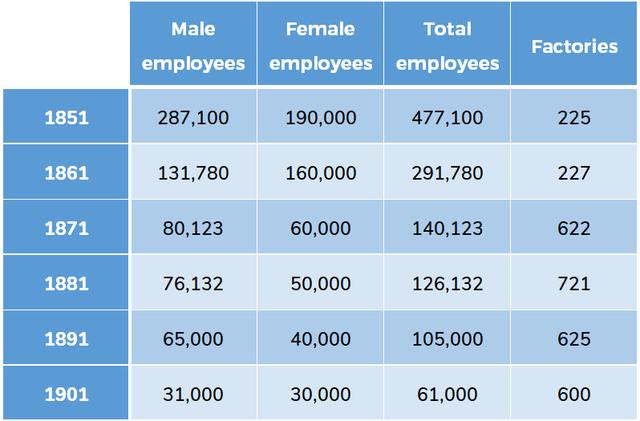
employees both male and female in two different states in the UK. Linking Words
Overall
, it was observed that both countries in 1851 recorded the highest numbers of employees, of which males topped the chart. Linking Words
While
1901 had the least employed.
Linking Words
To begin
, 1851 listed the highest of male employeesLinking Words
,
and had a total number Consisting of both genders evidenced by a figure of 477,100 individuals. As the years progresses there was a significant decline, as the total of those employed dropped from 477,100 in 1851 to 61,000 in 1901. Remove the comma
apply
Similarly
, genderwise, over a 6 years period dropped from 287,100 and 190,00 to 31,00 and 30,00 respectively with women being the least employed.
As regards factories, Linking Words
however
, 1851 had the smallest statistics, there was a 2% increase in 1861 with a spontaneous growth to 625 in 1871. During the years, 1881 documented a major rise in the industry with a figure of 721 after which it took a downturn to 600 in 1901.Linking Words