
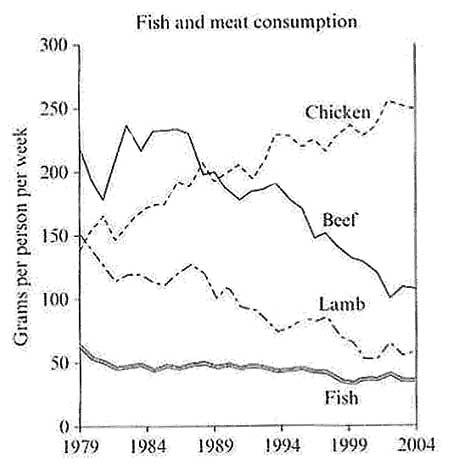
This
line chart illustrates the Linking Words
consumption
of different types of animal-based protein sources in a specific European territory. To add up, Use synonyms
this
graph conveys Linking Words
this
evolution from 1979 to 2004 and is measured in grams per person per week.
Linking Words
Overall
, I can clearly observe three different trends. Chicken meals had skyrocketed Linking Words
while
beef and lamb ones had been Linking Words
steadly
decreasing. Concerning fish Correct your spelling
steadily
consumption
, Use synonyms
this
downside trend had been slightly stabilised from 1984 to 2004.
Indeed, the upward trend in chicken buyings had been impressive. It Linking Words
had
reached an all-time peak in 2004 (250 grams per person per week) coming from less than 150 grams per person per week in 1979. It represented nearly a 100% increase in only 25 years.
Unnecessary verb
apply
However
, the downside had been suffered Linking Words
by
beef and lamb whose Change preposition
apply
consumption
had plummeted more than 50% in the same period.
When it comes to fish, the evolution is less Use synonyms
agressive
. Rather than moving in a precise direction, fish Correct your spelling
aggressive
consumption
had, at Use synonyms
first,
decreased and reached a plateau since 1984.Linking Words