
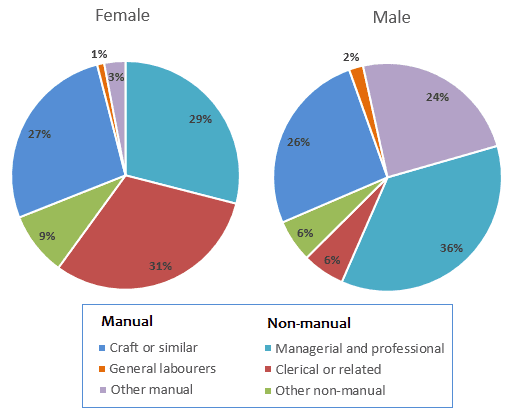
The pie charts give information about the employment pattern of both males and females in Great Britain in 1992.
This
is done in percentages. Linking Words
Overall
, it is observed that managerial and professional had the highest number of employees Linking Words
while
General labourers recorded the least.
Linking Words
To begin
, it is observed that both genders had a good number of persons in craft or similar with a figure of 27 per cent in female and 26 per cent in male respectively. The general labourers had 1% of women and 2% of men. Other manuals documented 24% of males which is 21% more than females which had 3%.
In regards to the non-manual , managerial and professional listed majority of both genders, with 36 per cent in of men and 29% women. Clerical had a figure of 31% and 6%.Other non-manuals had about 9% to 6% in males and females correspondingly.Linking Words