
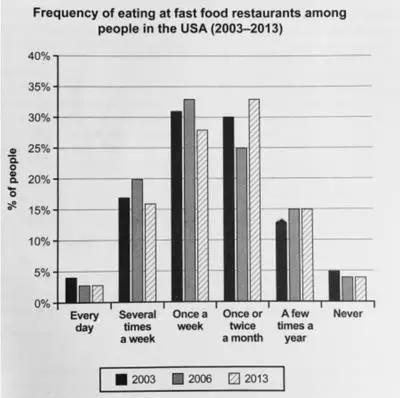
The following chart illustrates the percentage of the frequency of eating fast food in the USA from 2003 to 2013.
Overall
, the maximum percentage of eating fast food is once a Linking Words
week
and once or twice a Use synonyms
month
in these three years (2003, 2006, and 2013). Use synonyms
In addition
, the frequency of eating has 6 different Linking Words
times
(every day, several Use synonyms
times
a Use synonyms
week
, once a Use synonyms
week
, once or twice a Use synonyms
month
, a few Use synonyms
times
a Use synonyms
year
, and never).
Use synonyms
To begin
with, in 2003, the percentage of eating fast food increased from 4% to 31% which includes several Linking Words
times
a Use synonyms
week
, once a Use synonyms
week
, and once or twice a Use synonyms
month
. Use synonyms
However
, it reduced from 31% to 5% which includes a few Linking Words
times
a Use synonyms
year
and never.
In 2006, it sharply increased from 3% to 32% which includes every day, several Use synonyms
times
a Use synonyms
week
, and once a Use synonyms
week
. But it significantly reduced from 30% to 5% which includes once or twice a Use synonyms
month
, a few Use synonyms
times
a Use synonyms
year
, and never.
In 2013, it sharply increased from 3% to 32% which includes every day, several Use synonyms
times
a Use synonyms
week
, once a Use synonyms
week
, and once or twice a Use synonyms
month
. Use synonyms
However
, it significantly reduced from 15% to 4% which includes a few Linking Words
times
a Use synonyms
year
and never.Use synonyms