
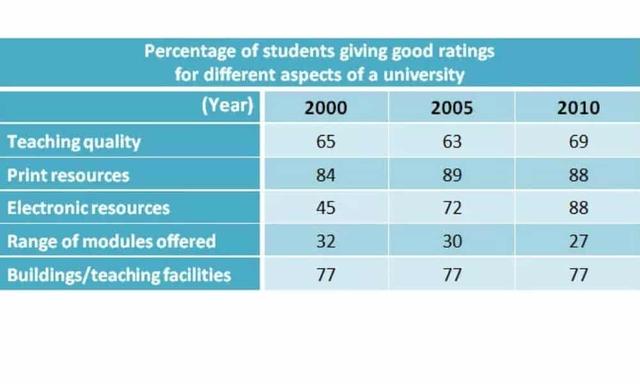
The tabular representation illustrates the information regarding the number of polls by learners in three different 3 years.The data is calibrated in percentage.
Overall
,in 2000 and 2005 the maximum percentile of polls was for print resources and in 2010 the minimum poll was given to a range of modules offered.
At a fleeting glance,in 2000 technical quality was given Linking Words
65
% of Change preposition
by 65
Add an article
the poll
poll
Fix the agreement mistake
polls
while
the number of votes decline in 2005 by 2%.Linking Words
Moreover
,in 2000,2005 and 2010 similar votes were given by juveniles to building and teaching facilities.In 2000, slightly more polls were given to a range of modules offered which was 32% as compared to 2005.In 2010, the maximum proportion of learners polled both print and electronic resources .
Probing ahead, a greater sum of students were involved in print resources in 2005 which was 89%.In ,addition fewer learners were involved in technical quality in 2005 Linking Words
whereas
in 2010 the votes escalated which was 69% .The minimum sum of students Linking Words
were
interested in the range of modules offered in all 3 years.Change the verb form
was