
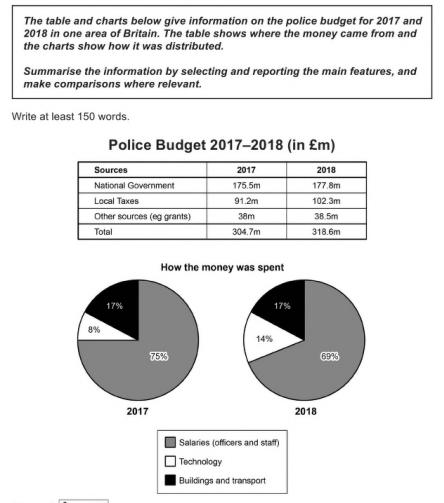
The chart indicates where the police
budget
came from and how the money was used in 2017 and 2018.
For the incoming, the total Use synonyms
budget
was increased from 304.7 Use synonyms
million
to 318.6 Use synonyms
million
. There are two main resources which are national government supports and local taxes. It is worth mentioning that the national government provided more than half of the total incoming, which was 175.5 Use synonyms
million
in 2017 and 177.8 Use synonyms
million
in 2018. Meanwhile, the local taxes rose at a remarkable speed, an increase of more than one-ninth.
When it comes to how the money was spent, the percentage of buildings and transport was constantly 17% in these two years. Use synonyms
However
, the Linking Words
budget
allocated for technology increased from 8% to 14% in 2018, nearly doubling from the previous year. Use synonyms
On the contrary
, the public Linking Words
budget
spent on salaries for officers and staff, which occupied the majority of the money, decreased to 69% from 75% in 2018.Use synonyms