
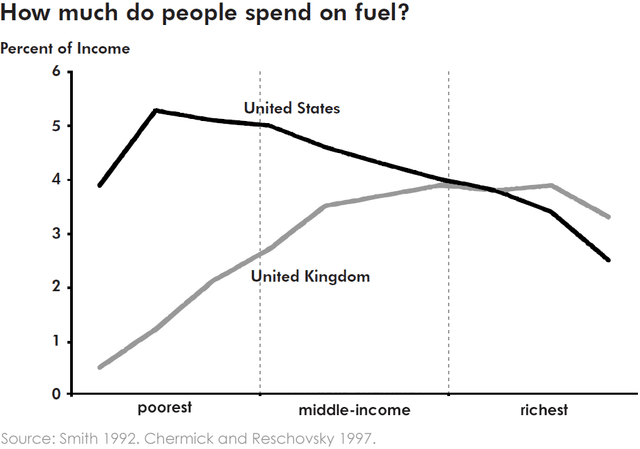
The line chart illustrates how much
people
consumed Use synonyms
fuel
in the United States and the United Kingdom. Looking from an Use synonyms
overall
perspective, it is readily apparent that the poorest and middle-income rage American spend more on energy purchases Linking Words
whereas
Linking Words
British
rich Use synonyms
Use synonyms
people
willing to pay more for car Add a verb
arepeople
werepeople
fuel
.
In terms of the poorest range of Use synonyms
people
, American spend more than the Use synonyms
British
. it begins at almost 4% and Use synonyms
then
peaks at 5.2%, Linking Words
at the end
of the period, it slightly falls to 5% Linking Words
while
Britain's Linking Words
fuel
Use synonyms
expenditure
comes to a dramatical growth and finishes at 2.8%.
When it comes to middle income, the Use synonyms
fuel
Use synonyms
expenditure
of American decrease steadily until Use synonyms
British
Use synonyms
fuel
Use synonyms
expenditure
increased sharply and Use synonyms
then
Linking Words
finally
surpass the rage of rich Linking Words
people
in the UK. Use synonyms
This
statistic conducted by Cermik and Reschovsky in 1997, shows the end of the survey is America has plumped into a nadir with 2.3% of Linking Words
fuel
Use synonyms
expenditure
and Use synonyms
British
comes to 3.1% after a little bit of a fall.Use synonyms