
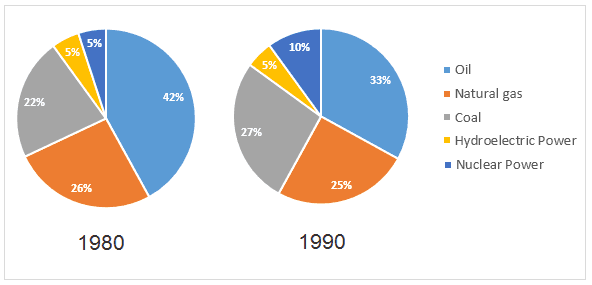
The chart illustrates the production methods of electric energy in the United States in 1980 and 1990.
Overall
, it is apparent that more utilisation of non-renewable energy resources was prevalent for the manufacture of electricity. There was a sharp decline in the use of nuclear power which was compensated Linking Words
with
Change preposition
by
increasing
use of coal and oil.
The use of fossil fuels was the predominant source of production of electricity in the US in 1990. The percentage of electrical production through coal jumped to 27% in 1990 from 22% in 1980. Correct article usage
the increasing
Furthermore
, the usage of oil Linking Words
also
increased to 10% in 1990 from 5% in 1980.
The dependence on nuclear power reduced substantially from 42% in 1980 to 33% in 1990 in the country. Linking Words
In contrast
, the usage of hydroelectricity power for electricity generation remained constant at 5% Linking Words
while
there was only a slight decrease in utilisation of natural gas which only dropped by 1% over the decade.Linking Words