
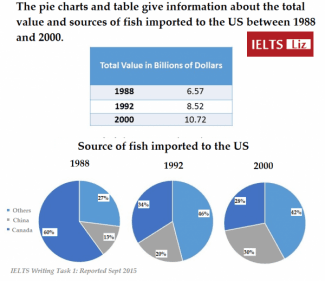
The given table and pie charts indicate the total
value
in billions of Use synonyms
dollars
and the Use synonyms
proportion
of 3 countries where Use synonyms
US
imported Correct article usage
the US
source
of Correct article usage
a source
fishes
from 1988 to 2000.
Fix the agreement mistake
fish
Overall
, the total Linking Words
value
in billions of Use synonyms
dollars
showed Use synonyms
an
gradual increase. Change the article
a
Moreover
, the Linking Words
percantage
of imported Correct your spelling
percentage
fishes
from Canada accounted for the largest Fix the agreement mistake
fish
proportion
in 1988 Use synonyms
while
it was replaced Linking Words
to
that of other countries between 1992 and 2000.
Looking at the first chart, the amount Change preposition
by
value
of Use synonyms
dollars
gradually went up from 6.57 billion to 10.72 billion during 12 years until 2000. The total Use synonyms
value
of Use synonyms
dollars
in 1988 was three-fifths of that in 2000.
When it comes to the second one, the Use synonyms
proportion
of sources from Canada comprised the biggest recording 68% in 1988, over half of the pie. Use synonyms
However
, it experienced Linking Words
constant
decrease throughout the period marking 34% in 1992 and 28% in 2000 respectively. Correct article usage
a constant
Instead
, the largest figure was changed into the Linking Words
percantage
of sources from other countries at 45% in 1992 and 42% in 2000 respectively. When it comes to China, Correct your spelling
percentage
while
its figure was relatively Linking Words
nigligible
compared to the others from 1988 to 1992, the figure showed Correct your spelling
negligible
an
constant upward trend and accounted for the second largest Change the article
a
proportion
recording 38% in 2000.Use synonyms