
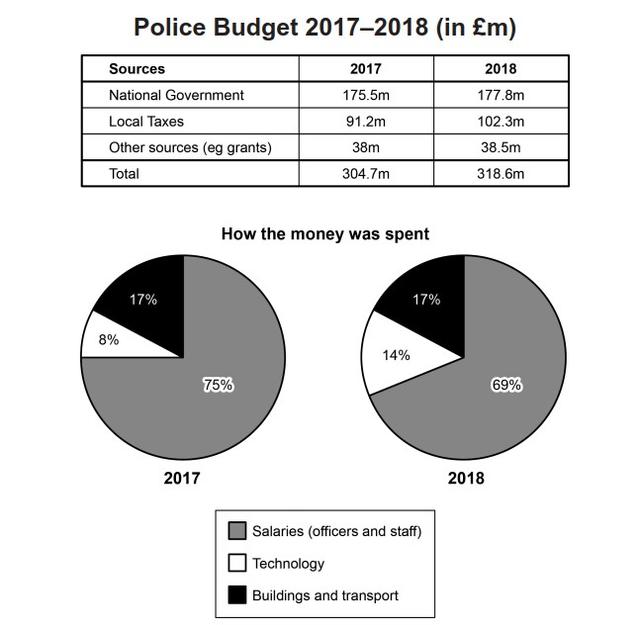
The table and charts give information on how much
budget
the police invested for 2017 and 2018 in certain Use synonyms
area
of Britain. The table gives information about the origin of the Fix the agreement mistake
areas
money
and the charts explain the way it was spent.
Use synonyms
Overall
, Linking Words
it is clear that
the total amount of the police Linking Words
budget
increased and the percentage of the Use synonyms
money
spent on salaries was the most in both years.
Looking at the table more closely, in 2017, the amount of the Use synonyms
budget
for the national government was the highest, at 175.5 Use synonyms
million
, Use synonyms
whereas
that of the Linking Words
budget
for other sources was the lowest, at 38 Use synonyms
million
, and Use synonyms
in addition
, 91.2 Linking Words
million
was used for local taxes. Use synonyms
Likewise
, the Linking Words
figure
for the Use synonyms
budget
for the national government was the highest, at 77.8 Use synonyms
million
, followed by 102.3 Use synonyms
million
which was used for local taxes and the amount of the Use synonyms
budget
for other sources was the lowest, at 38.5 Use synonyms
million
.
When it comes to the charts, in 2017, the percentage of the Use synonyms
money
used for salaries was the highest, at 75%, followed by that of the Use synonyms
budget
for buildings and transport, at 17% and 8% of the Use synonyms
money
was spent on the technology which was the lowest. In 2017, the Use synonyms
figure
for the Use synonyms
budget
for salaries decreased to 69%, Use synonyms
while
the Linking Words
figure
for the Use synonyms
budget
for technology almost doubled, and the Use synonyms
figure
for the Use synonyms
budget
for buildings and transport remained the same.Use synonyms