
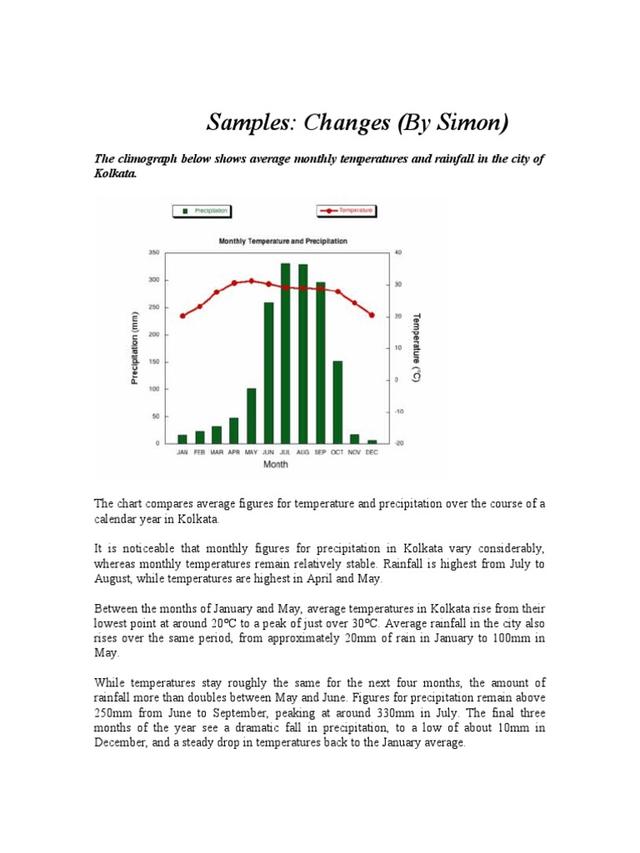
The supplied bat chart provides information about average data for temperature and rain amount during one year in Kolkata.
Overall
, it can be seen that the precipitation figures are highest during the summer Linking Words
while
the hottest month is May.
Getting back to details, from January to May there is a gradual increase in Linking Words
rain
figure starting just from over 25 to above 100, Correct article usage
the rain
then
in June Linking Words
this
figure sees a significant rise to around 250 and reaches a peak in July with almost 350. In the Linking Words
last
two months of the Linking Words
year
it drops dramatically to its lowest proportion.
In terms of temperature, the coolest weather is measured in January with roughly 20 degrees, after that we can observe an upward trend to the warmest month which is May and its temperature is approximately 30 degrees. During July, August and Add a comma
,year
September
the graph remain relatively stable and Add a comma
,September
then
fell to around 20 degrees in December.Linking Words