
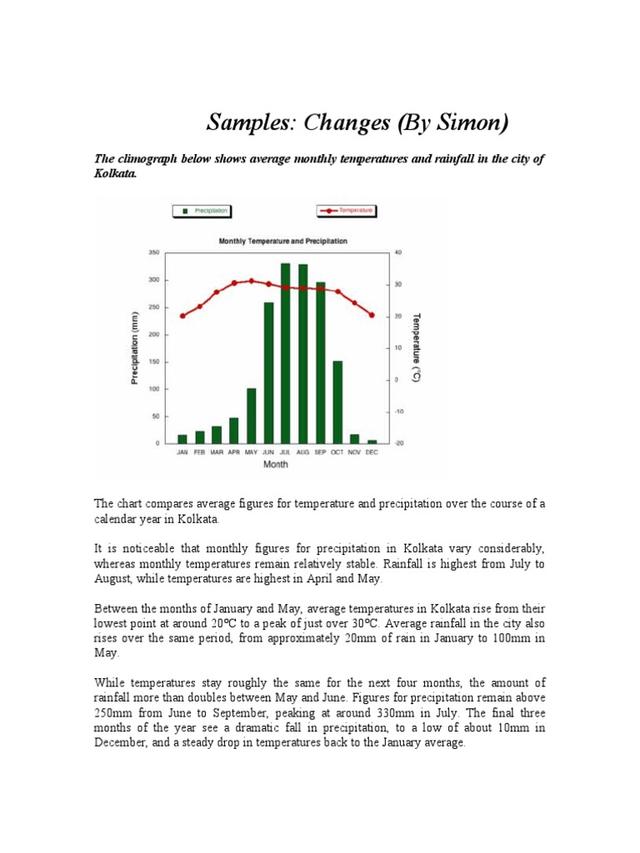
The graph illustrates about median point comparison of heat degree and rain rate in the yearly period in Kolkata.
In general, there are two parameters, temperature and precipitation, which are used in the chart and monthly data for the whole year.
The precipitation rate starts at almost 10
mm
. Use synonyms
This
value slightly rises until May with 100 Linking Words
mm
. After that, it increases significantly in the next month to 250 Use synonyms
mm
. Use synonyms
Then
pick up about 325 and steadily in July and August. Linking Words
In contrast
, Linking Words
this
number drops to about 300 in the next period and begins to decline rapidly in October and continues until December with a final rate of about 2 Linking Words
mm
.
The temperature itself has slightly inclined since the first period. After steadily about 30 degrees, Use synonyms
then
down smoothly until October with about 28 degrees. Linking Words
Moreover
, the value to Linking Words
continues
drop gradually in November and December with about 20 degrees Add the particle
tocontinues
last
year.Linking Words