
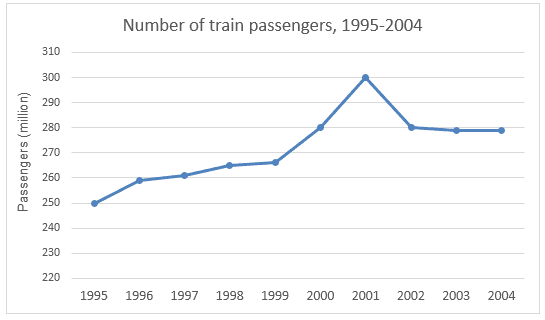
The first and second line graph depicts information about the number of people using
trains
in Sidney and the proportion of the lines that work within the time between 1994 and 2004.
Use synonyms
Overall
, the number of passengers increased steadily from 1994 till 2000 Linking Words
while
the proportion of punctual Linking Words
trains
fluctuated over the years.
In 1995, Use synonyms
trains
were a means of transport for 25 million people in Sidney. Use synonyms
This
increased gradually until 2000 before reaching a peak of 500million passengers in 2001. The numbers fell to 200 million in 2002 and Linking Words
then
levelled off at approximately the same figures for the remaining years.
Linking Words
On the other hand
, almost 95% of railway Linking Words
trains
were working on time in 2004 even though passengers turn up were least in that year compared to the others. Use synonyms
This
decreased to 85% in 1995 and Linking Words
further
increased to about 95% in 1999. caravans were least punctual in 2004 with just about 72% punctuality.Linking Words