
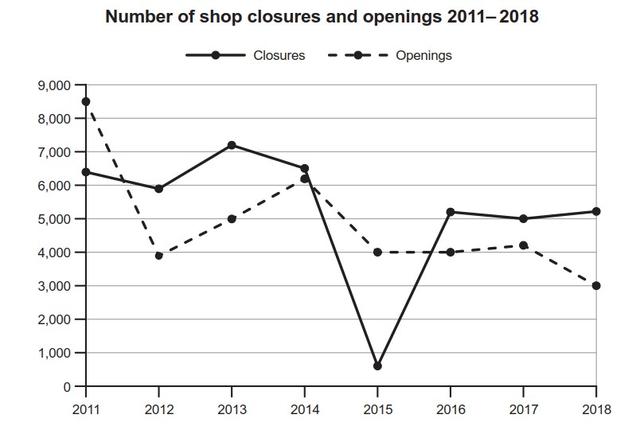
The given graph depicts the number of
closures
and openings of outlets that took place in one nation between 2011 and 2018. Looking from an Use synonyms
overall
perspective, it is evident that the stores that closed outweigh the ones that opened.
Taking a closer look the dotted line that represents the openings has a more stable course in comparison with the continuous one that illustrates the Linking Words
closures
. In more detail,the new businesses peaked in 2011 reaching up to 9000 , Use synonyms
while
the next year presents a major drop to almost 4000 . A recovery period that lasted until 2014 follows by slightly more than 6000 openings, whilst a plateau phase takes place between 2015 to 2017 with around 4000 new shops.,Linking Words
Finally
the number is reduced to 3000 in 2018.
Linking Words
On the other hand
, the Linking Words
closures
fluctuate around to 6000 and 7000 in the first four years of the gine period. Use synonyms
On the
Linking Words
contrary
a sharp decrease happens in 2015 when the Add a comma
,contrary
closures
fall from roughly 6500 to less than 1000. Use synonyms
Although
the following year has an upward trend reaching up to 5000 Linking Words
closures
, a number Use synonyms
that is
maintained until 2018Linking Words