
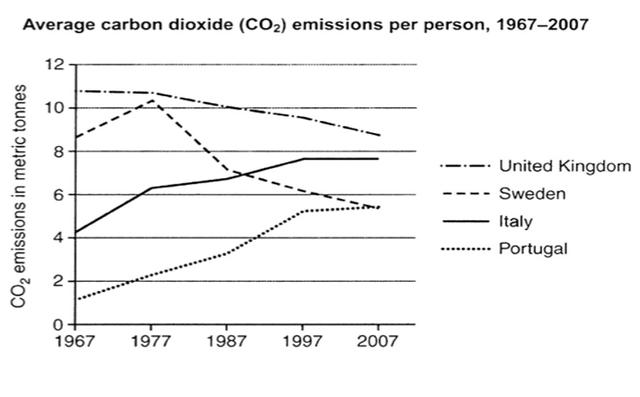
The line graph illustrates the average carbon dioxide (Co2) emissions per person in four countries (
UK
, Sweden, Italy, and Portugal) which were produced over 40 years from 1967 to 2007. Units are measured in metric Use synonyms
tonnes
.
Use synonyms
Overall
, the emission of CO2 in the Linking Words
UK
and Sweden decreased over the period given, Use synonyms
while
in Italy and Portugal, they increased. Linking Words
UK
had the highest CO2 emission over the given four decades.
With regards to the emission of CO2 in the Use synonyms
UK
,it stood at approximately 11 metric Use synonyms
tonnes
in 1967 and Use synonyms
then
fell slightly to more than 8 metric Linking Words
tonnes
in the final Use synonyms
year
. Use synonyms
Similarly
, in Sweden, Linking Words
at
around 9 metric Change preposition
apply
tonnes
Use synonyms
was
produced in the first Correct subject-verb agreement
were
year
after which it Use synonyms
reaching to
10 metric Wrong verb form
reached
tonnes
in 1977 before dropping to a low of about 5 metric Use synonyms
tonnes
in 2007.
Use synonyms
On the other hand
, the production of CO2 in Italy was about 4 metric Linking Words
tonnes
in the first Use synonyms
year
and it Use synonyms
then
peaked at almost 5 metric Linking Words
tonnes
in the final Use synonyms
year
. Use synonyms
Likewise
, in Portugal, the emissions stood at nearly 4 metric Linking Words
tonnes
in the first Use synonyms
year
and Use synonyms
this
figure fluctuated slightly Linking Words
and
reaching about 8 metric Correct word choice
apply
tonnes
in 2017.Use synonyms