
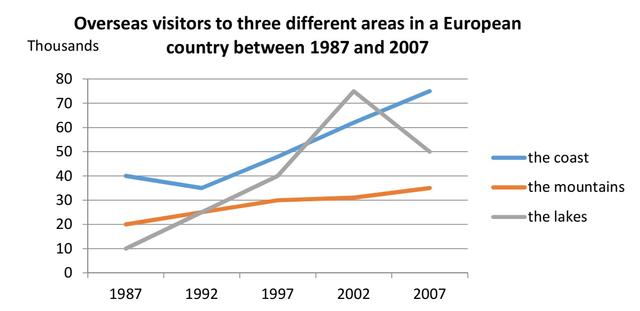
The line graph illustrates the amount of three kinds of areas in European nations ( the coast, the
mountains
, and the lakes) which were visited over 20 years from 1987 to 2007. Until are measured in thousands.
Use synonyms
Overall
, the Linking Words
visitors
to the coast, the Use synonyms
mountains
, and the lakes increased over the period given. At the start of the period, the coast was the most popular area, which was replaced by the Use synonyms
mountains
from 1987 to 2007, and following that the lakes became the most preferred place to go.
With regards to the number of coastal Use synonyms
visitors
, it began at around 40 Use synonyms
thousand
and Use synonyms
then
it increased to reach nearly 75 Linking Words
thousand
in the final year. Use synonyms
Likewise
, almost 20 Linking Words
thousand
Use synonyms
visitors
visited the Use synonyms
mountains
in 1987, and Use synonyms
then
the number of Linking Words
visitors
rose to reach just over 30 Use synonyms
thousand
in 2007.
Use synonyms
On the other hand
, the number of Linking Words
visitors
to the lake made up 20 Use synonyms
thousand
in the beginning and Use synonyms
then
it peaked at 75 Linking Words
thousand
in 2002 before falling to reach 50 Use synonyms
thousand
in the Use synonyms
last
year.Linking Words