
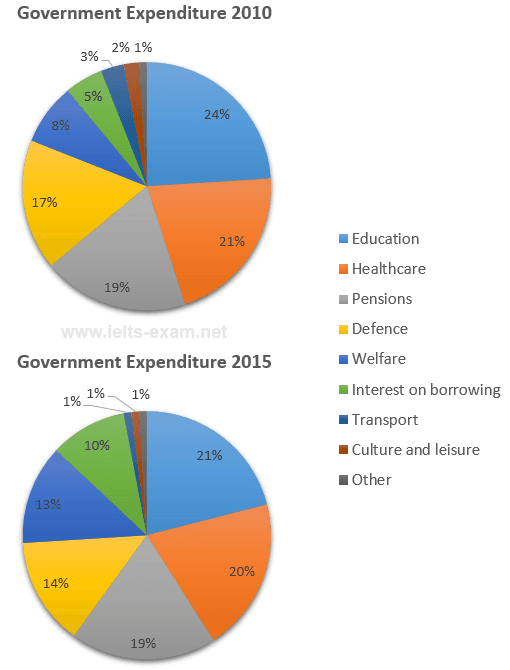
The pie chart gives information about
government
expenditure between 2010 to 2015 years . At first ,glance it is evident that education , healthcare and pensions spend more than other kinds of Use synonyms
government
.
Use synonyms
To begin
, in Linking Words
2010
year . Change the article
the 2010
This
year Linking Words
government
spend a significant amount on Education , which has approximately a quarter percentage , healthcare , pensions and defence Use synonyms
also
have similar indicators. Linking Words
However
the most under index in culture and leisure and welfare . They are not widely used, Linking Words
therefore
have below the norms. Average things which the Linking Words
government
spend rarely they are transport and interest on borrowing . Use synonyms
The both
kinds have one in twenty per cent. A Remove the article
Both
simillar
pattern shows in the 2015 period . The indicators remain unchanged , Correct your spelling
similar
Linking Words
however
the amount of welfare increases to thirteen per cent, Add the comma(s)
,however
likewise
the interest on borrowing Linking Words
also
grows to one in ten indexes. The number of pensions slightly alters.Linking Words