
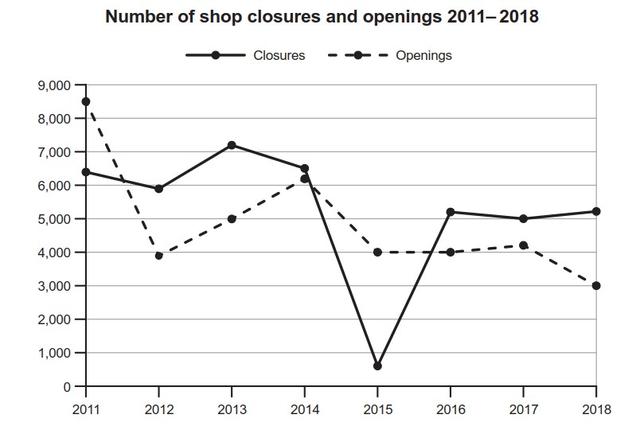
the channel graph shows the data on the closures and
openings
of boutiques from the year 2011 or 2018. Use synonyms
this
graph has a solid boundary dedicated to the pointer of closures and a dotted edge which refers to the Linking Words
openings
.
from an Use synonyms
overall
perspective, it is crystal clear that the deepest fall of closing outlets in the year 2015 was a fast decline of more than 500 department stores in total. Linking Words
Whereas
the gradual increase comes in the period between 2012 to 2014 so on closing number floats in widely between 6000 to 7000. Linking Words
Furthermore
, the line moderately goes straight in the term 2016 to 2018 which has a number of stores near about 5000 - 5500 approx.
Linking Words
On the other hand
, Linking Words
openings
have more drastic changes as compared to closings Use synonyms
such
as between the period 2011 to 2012 opening is doing well reaching the till mark of 8500. Linking Words
Although
has a steep decline in the time 2012 to reach 4000. Linking Words
Moreover
, Linking Words
openings
have slight changes in the year 2014 increasing gradually from term 2012 to 2014 coming to a number of 6000. Use synonyms
In Addition
, the dot lines floated constantly in the stage from 2015 to 2017 and Linking Words
then
a little decrease entered.
Linking Words
overall
, it can be referred that the showroom is more Linking Words
openings
than closings from the time zone 2011 to 2018 period.Use synonyms