
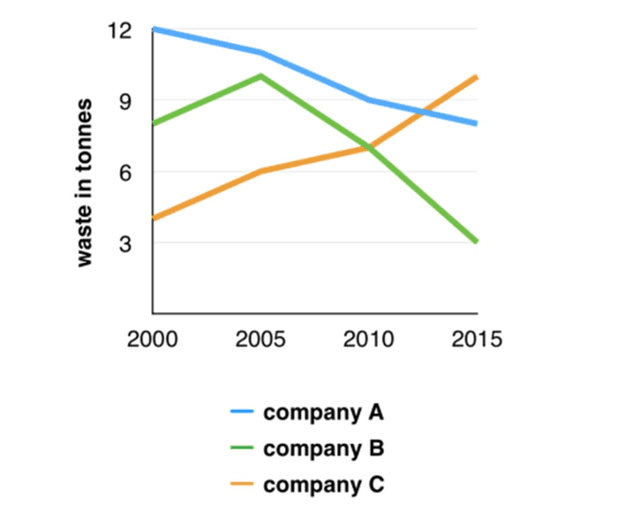
The line graph illustrates the
number
of Use synonyms
waste
generated between 2000 and 2015 by companies A, B, and C.
Use synonyms
Overall
, the amount of Linking Words
waste
produced in both Use synonyms
Use synonyms
company
A and B declined. Fix the agreement mistake
companies
Whereas
, Linking Words
company
C had a significant increase over the period given.
Use synonyms
Initially
, Linking Words
company
A started with the highest Use synonyms
number
of Use synonyms
waste
which is 12 Use synonyms
tonnes
in 2000. Use synonyms
Then
, it slowly fell by reaching 8 Linking Words
tonnes
Use synonyms
at the end
of the period. On the other side, Linking Words
company
B reached a peak Use synonyms
on
managing trash in 2005 by 10 Change preposition
in
tonnes
. After that, it had Use synonyms
dramatic
fall in 2015 reaching just 3 Correct article usage
a dramatic
tonnes
which Use synonyms
the
lowest Add a missing verb
is the
number
among the three companies.
Use synonyms
On the other hand
, Linking Words
company
C has a different pattern. It steadily increased the Use synonyms
number
of Use synonyms
the
Correct article usage
apply
waste
generated reaching 10 Use synonyms
tonnes
by the end of the period.Use synonyms