
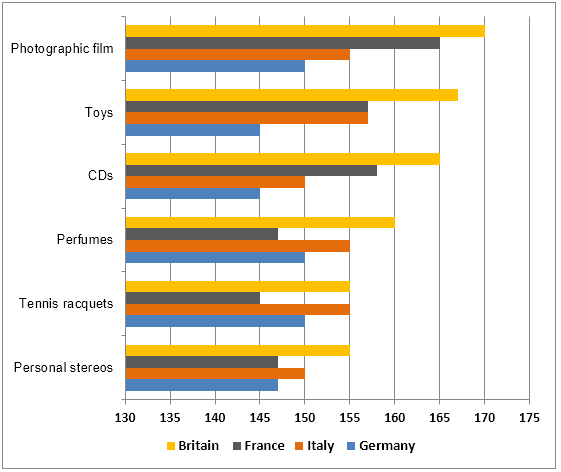
The given chart illustrates four European Countries spent on six consumers of goods.
Overall
, Britain spent much on photographic Linking Words
film
, Use synonyms
toys
, Use synonyms
CDs
, and Use synonyms
perfumes
. France spent more on photographic Use synonyms
film
and Use synonyms
CDs
. Italians spent more on Use synonyms
toys
and Germany on Use synonyms
perfumes
, Use synonyms
tennis
Use synonyms
racquets
, and Use synonyms
perfumes
.
Use synonyms
To begin
with, the highest spending for British people is on photographic Linking Words
film
at 170 and the lowest is on Use synonyms
tennis
Use synonyms
racquets
and personal Use synonyms
stereos
at 155. Britain spent 167 on Use synonyms
toys
. Next is for Use synonyms
CDs
at 165 and Use synonyms
perfumes
at 160. France spent 165 on Photographic Use synonyms
film
which is the highest and Use synonyms
tennis
Use synonyms
racquets
be the most unpopular one at 145. The second rank is Use synonyms
Cds
at 157. Next is Use synonyms
Toys
at 156. The perfume and personal Use synonyms
stereos
on the same amount at 147. Use synonyms
Next,
the highest spending in Italy is on Linking Words
Toys
at 155 and 150 for Use synonyms
CDs
and Personal Use synonyms
stereos
. The same proportion happens to photographic Use synonyms
film
, Use synonyms
perfumes
, and Use synonyms
tennis
Use synonyms
racquets
at 155. Use synonyms
Finally
, German people spend on photographic Linking Words
film
, Use synonyms
perfumes
, and Use synonyms
tennis
Use synonyms
racquets
147. The second rank is Use synonyms
perfumes
and Use synonyms
tennis
Use synonyms
racquets
at 150. Next is personal Use synonyms
stereos
at 146 and spend less on Use synonyms
toys
and Use synonyms
CDs
.Use synonyms